Timeline Interface Demonstrator
On 19 November 2021, the Heritage Connector project held a one-day hackathon in partnership with Cogapp.
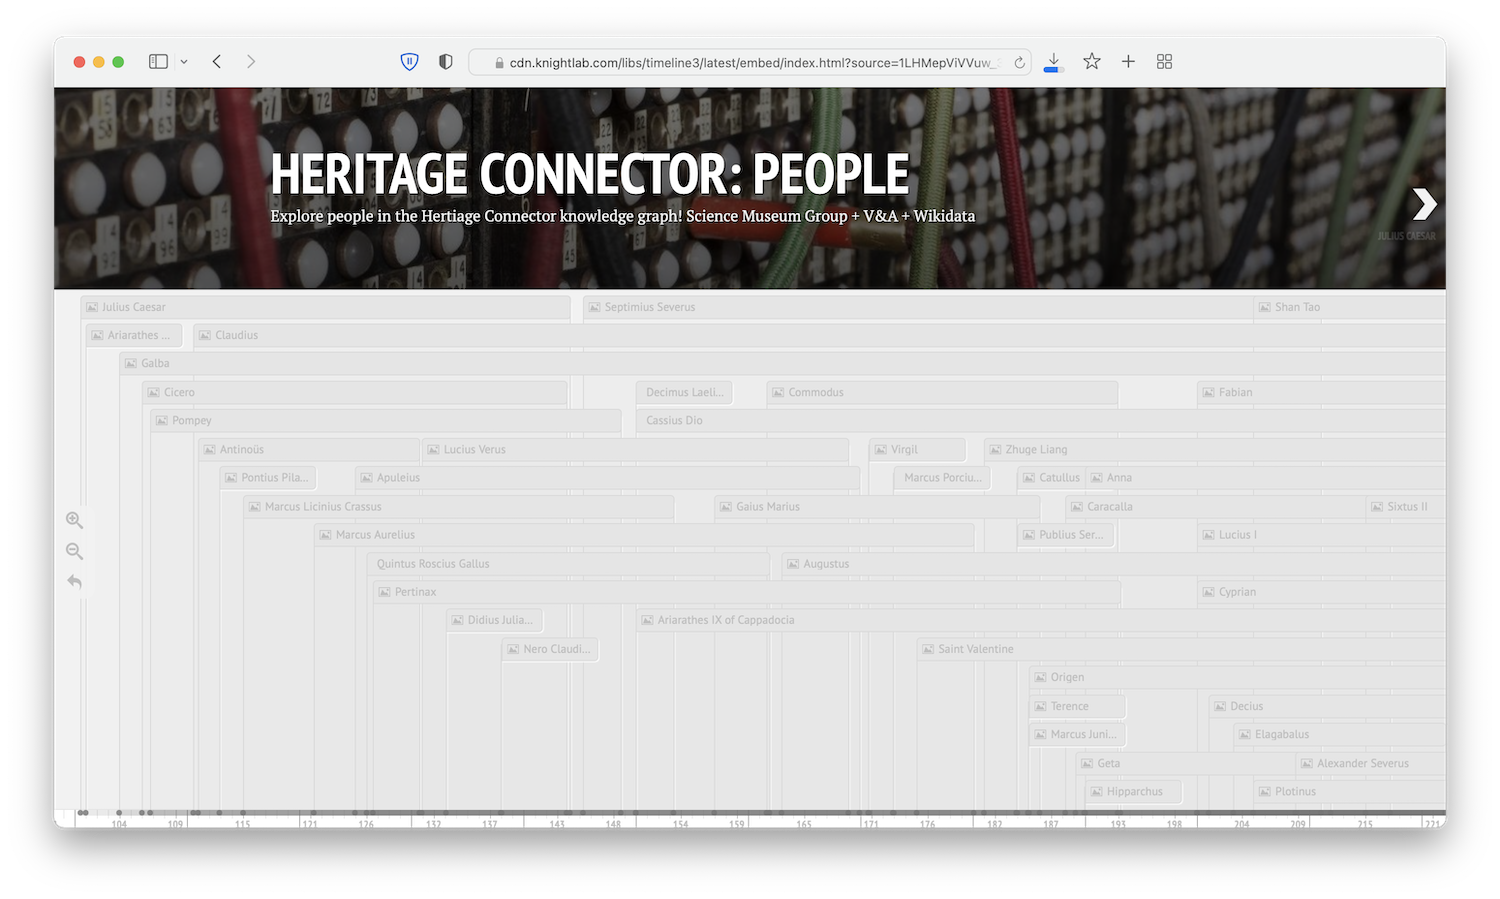
For our project Rhiannon Lewis and I (John Stack), worked with Timeline JS to build and interactive timelines for events and people in the knowledge graph.
The hc_dump_latest.csv file was wrangled in BBEdit to extract all the Wikidata QIDs.
These were then processed in OpenRefine to add the following Wikidata P (property) values for each of the list of QIDs:
- Date of birth
- Date of death
- Start time
- End time
- Announcement date
- Point in time
- Publication date
- Image (filename of any associated images)
The resulting data was then manipulated in OpenRefine into the required structure for Timeline JS, links to the Heritage Connector Metadata Explorer added, and then converted into Google Sheets: one for people and one for events.
These were then linked to Timeline JS to give the two timelines:
The performance of the timeline is quite slow as the maximum number of points on the timeline is recommended to be 200 and each of our timelines contains several thousand entries, which is itself only a tiny fraction of the number of people and events in the whole knowledge graph.