Imagining Interfaces for Cultural Heritage Knowledge Graphs
Rhiannon Lewis and John Stack
Introduction
The Heritage Connector project explores how AI-generated knowledge graphs can facilitate new forms of exploration, discovery and research for digitised cultural heritage collections. As covered in our previous blog post, all collection catalogue data:
- is inherently reductive;
- is uneven, incomplete and forever a work in progress;
- includes biases, both in content (where are there omissions?) and cataloguing which inevitably gives prominence to particular areas over others;
- is structured in a tabular format (usually in a relational database system).
As Windhager notes in Visualization of Cultural Heritage Collection Data: State of the Art and Future Challenges, ‘CH [cultural heritage] collections are assemblages inherited from the past, experienced in the present, and preserved for the future.’
To try to imagine how the Heritage Connector could be realised and accessed, existing interface paradigms currently employed by cultural heritage organisations online are revisited here, followed by an exploration of what knowledge graphs make possible for structuring and accessing data. Existing examples of how knowledge graphs have already been used with cultural heritage collections are introduced, to help demonstrate how building interfaces with knowledge graphs could lead to substantial shifts in how collections are explored. These shifts are considered through the following themes:
- Improved search results,
- Macro view of entire collection,
- Filtering and sorting,
- Serendipitous discovery,
- New entry points,
- Rich onward journeys,
- New forms of user interface.
Interface paradigms
Audiences’ experience of cultural heritage collections online is broadly similar across the numerous GLAM (galleries, libraries, archives and museums) organisations’ websites. The similarities in these experiences are a combination of emerging best practice, understanding of user needs, trends in web design, norms of audience behaviour and constraints of underlying catalogue data. The experiences are framed by a set of paradigms of collection discovery interfaces. These paradigms include:
- keyword search results with pagination,
- thumbnail images,
- creator and other groupings,
- filtering of search results on some parameters,
- cataloguing hierarchy,
- links to related content,
- “on displays” or location status,
- topic entry points.
While these paradigms serve some audiences and user needs adequately, or even well, and audience expectations of this approach are now well established, there are a number of limitations which are complex to overcome. Such approaches:
- tend to rely on search as the primary discovery mechanism with advanced search problematic available in many cases;
- allow filtering and sorting of content, however only by very well defined and populated fields, of which there are often very few;
- have few non-search entry points, as themes and topics tend not to be recorded and categories tend to be for internal collection management use and inadequate for the public;
- do not to work well across multiple institutions without comprehensive catalogue data alignment;
- evolve slowly in terms of functionality as additions of new data tables and fields need to be carefully considered;
- have limited potential for richer “generous interfaces” – “rich, browsable interfaces that reveal the scale and complexity of digital heritage collections” – which require comprehensive datasets and tend to amplify omissions and uneven cataloguing;
- have few onward links to related materials as these need to be manually added and managed which is overly onerous at scale;
- are hard to visualise as a whole collections showing overall contents and the relative sizes of these, as the data to implement such interfaces does not exist.
Knowledge graphs
As opposed to structured information systems (i.e. typical heritage collection tabular data models), using knowledge graphs to build interfaces can:
- handle complex relationships well;
- hold many different kinds of data relationships;
- quickly calculate relationships, such as “closeness” between interrelated things;
- bridge across disparate content without the need to merge datasets, and then infer new relationships;
- be highly flexible and can change and grow easily.
In 2012 the Google Knowledge Graph was launched in Introducing the Knowledge Graph: Things, Not Strings, which outlined the three areas they were beginning to use a knowledge-graph-based approached to search:
- “Find the right thing […] your results are more relevant because we understand these entities, and the nuances in their meaning”;
- “Get the best summary […] better understand your query, so we can summarize relevant content around that topic, including key facts you’re likely to need for that particular thing”;
- “Go deeper and broader […] the Knowledge Graph can help you make some unexpected discoveries”.
Knowledge graphs can help users discover new content, more intelligently present results, improve user experience and facilitate understanding. This is why they form the basis for a huge variety of content-rich discovery services such as Pinterest, Netflix, Facebook, Amazon and Airbnb.
Knowledge graphs and cultural heritage collections
In Heritage Connector, we’re interested in ways in which an AI-generated knowledge graph – such as the one we’re creating as part of our project – can fulfil the needs of the users of digitised cultural heritage collections and also overcome some of the limitations of the current approaches. The following outlines the areas we are considering:
1. Improved search results
Free text search is the primary established route into collections. The integration of additional content from a knowledge graph can extend vocabularies, and data can be used to drive the search results.
It’s not hard to imagine a cultural heritage collection search where the user doesn’t need to use exact spelling or precise terms to return high-quality results – similar to Google’s ability to be able to predict questions, make inferences with content and not be constrained by identical match for keyword position and frequency.
Furthermore, as previously discussed, collections online use taxonomies specific to their subject and museum. These terms may not be known or understood by those seeking exploring or searching in the collection through the free text search. Applying a knowledge graph to a collection(s) – as Heritage Connector seeks to – can expand what is possible to search by and the terms that can be used by extending information beyond that in catalogue to include other data/facts/”knowledge” into the knowledge graph from Wikidata and other collections.
2. Macro view of entire collection
It is notoriously difficult to grasp the contents of entire cultural heritage collections from their online interfaces. This is especially useful for collections that are extremely diverse (such as the Science Museum Group and V&A collections). Even descriptive texts about a given collection tend to lack the level of detail that most users would need to evaluate whether the collection would be valuable to them, because their authors often prefer to describe the collection in broad brush strokes.
As increasing volumes of cultural heritage content is published online, it will be increasingly important to be able to quickly and effectively get an overview of a collection and ideally to be able to do so through a number of different “lenses” selected or specified by the user.
Such visualisations can serve users who might not know the contents of the collection and maybe range across multiple collections in search of hotspots of content that are related to their interests.
Example: twoway.st
Example: Explore Art by Century
3. Filtering and sorting
Once users have subsets of collection objects, usually returned through a search query, it is useful for them to be able to filter and sort these objects in different ways to narrow down search results and then explore this subset further.
This mid-level interface is important as it transitions the user from the high-level “macro” overview to individual object records (see Visualization of Cultural Heritage Collection Data: State of the Art and Future Challenges and The Eyes Have It: A Task by Data Type Taxonomy for Information Visualization).
The dimensions by which filtering and sorting can be implemented in the interface is directly related to the underlying collection metadata, which – in current database approaches – need to be highly structured and broadly and consistently applied to provide a useful user interface. In practice, this means that for many collections such filtering and sorting features are limited.
Using data from the knowledge graph, the number of dimensions for sorting and filtering can be dramatically increased and can vary depending on the particular content being accessed. Furthermore, these filters do not need to be contained in the collection catalogue as they can be inferred from the wider knowledge graph.
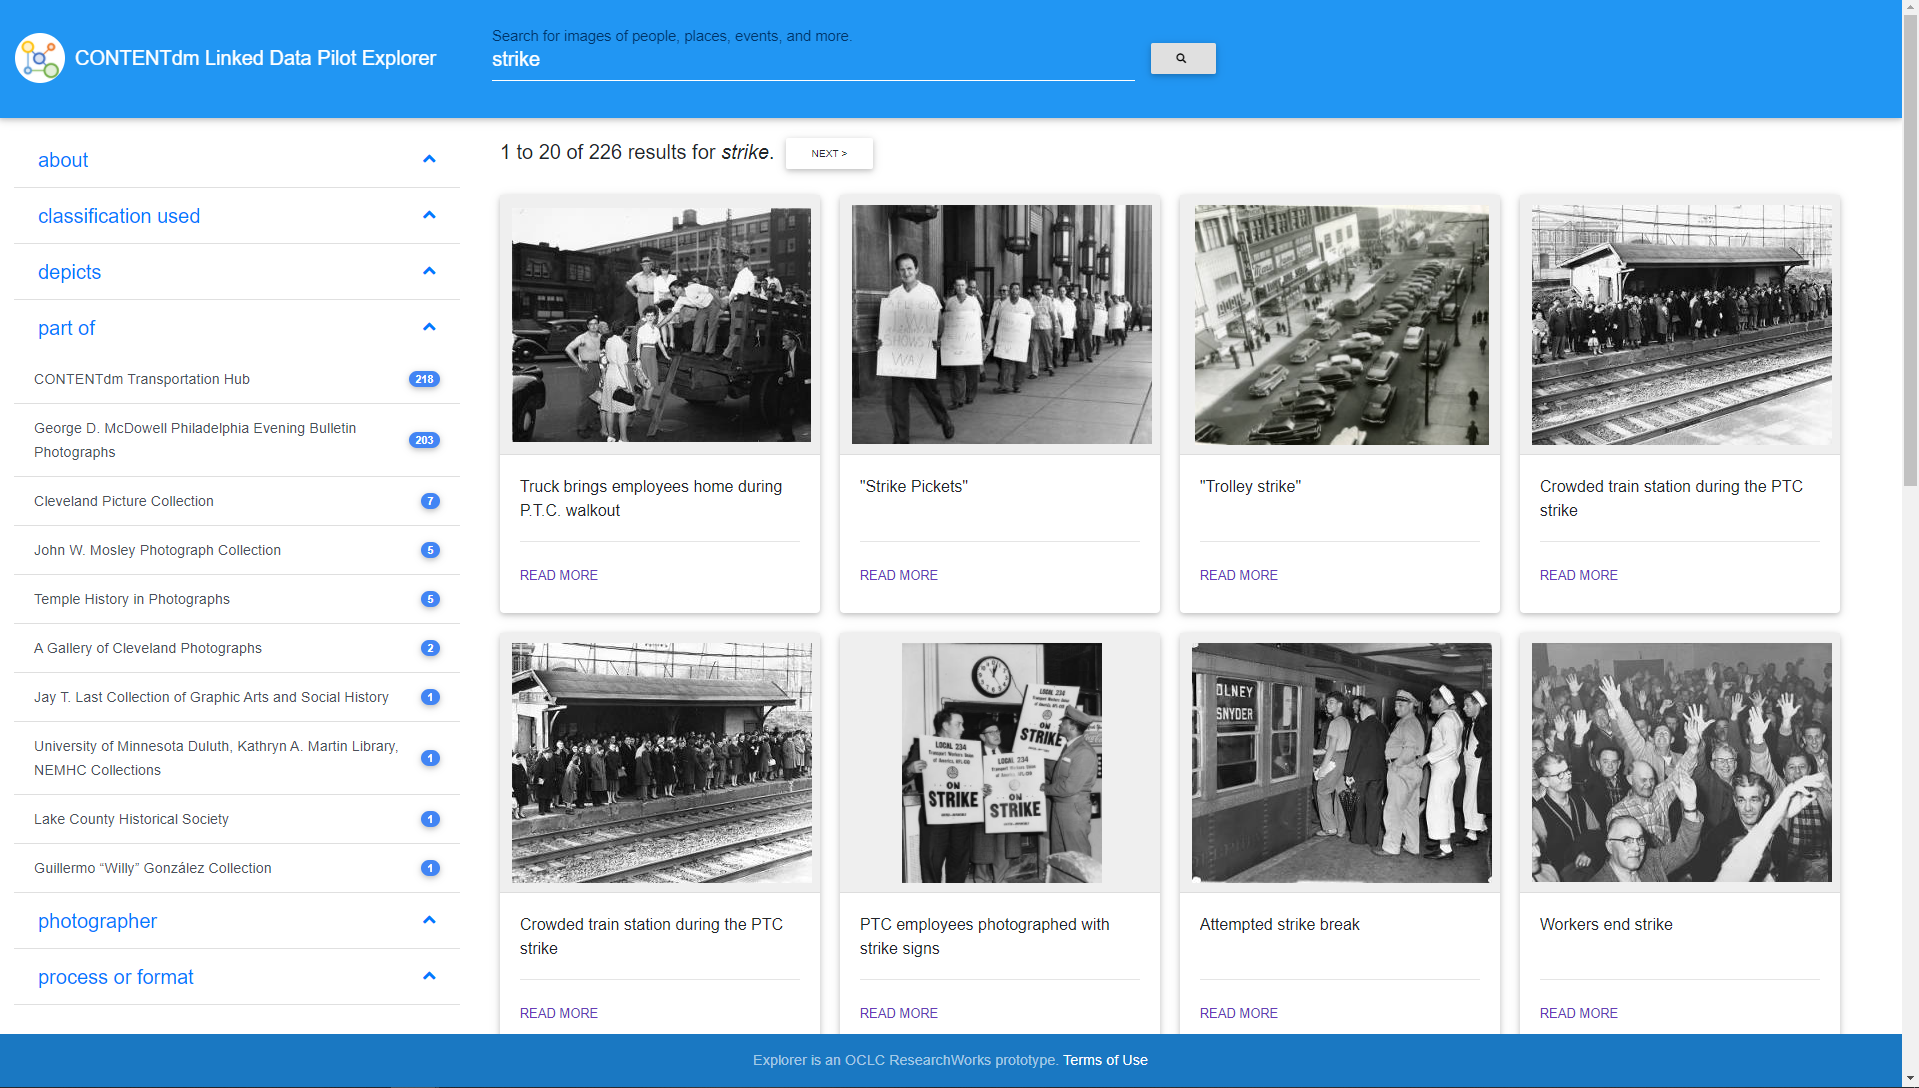
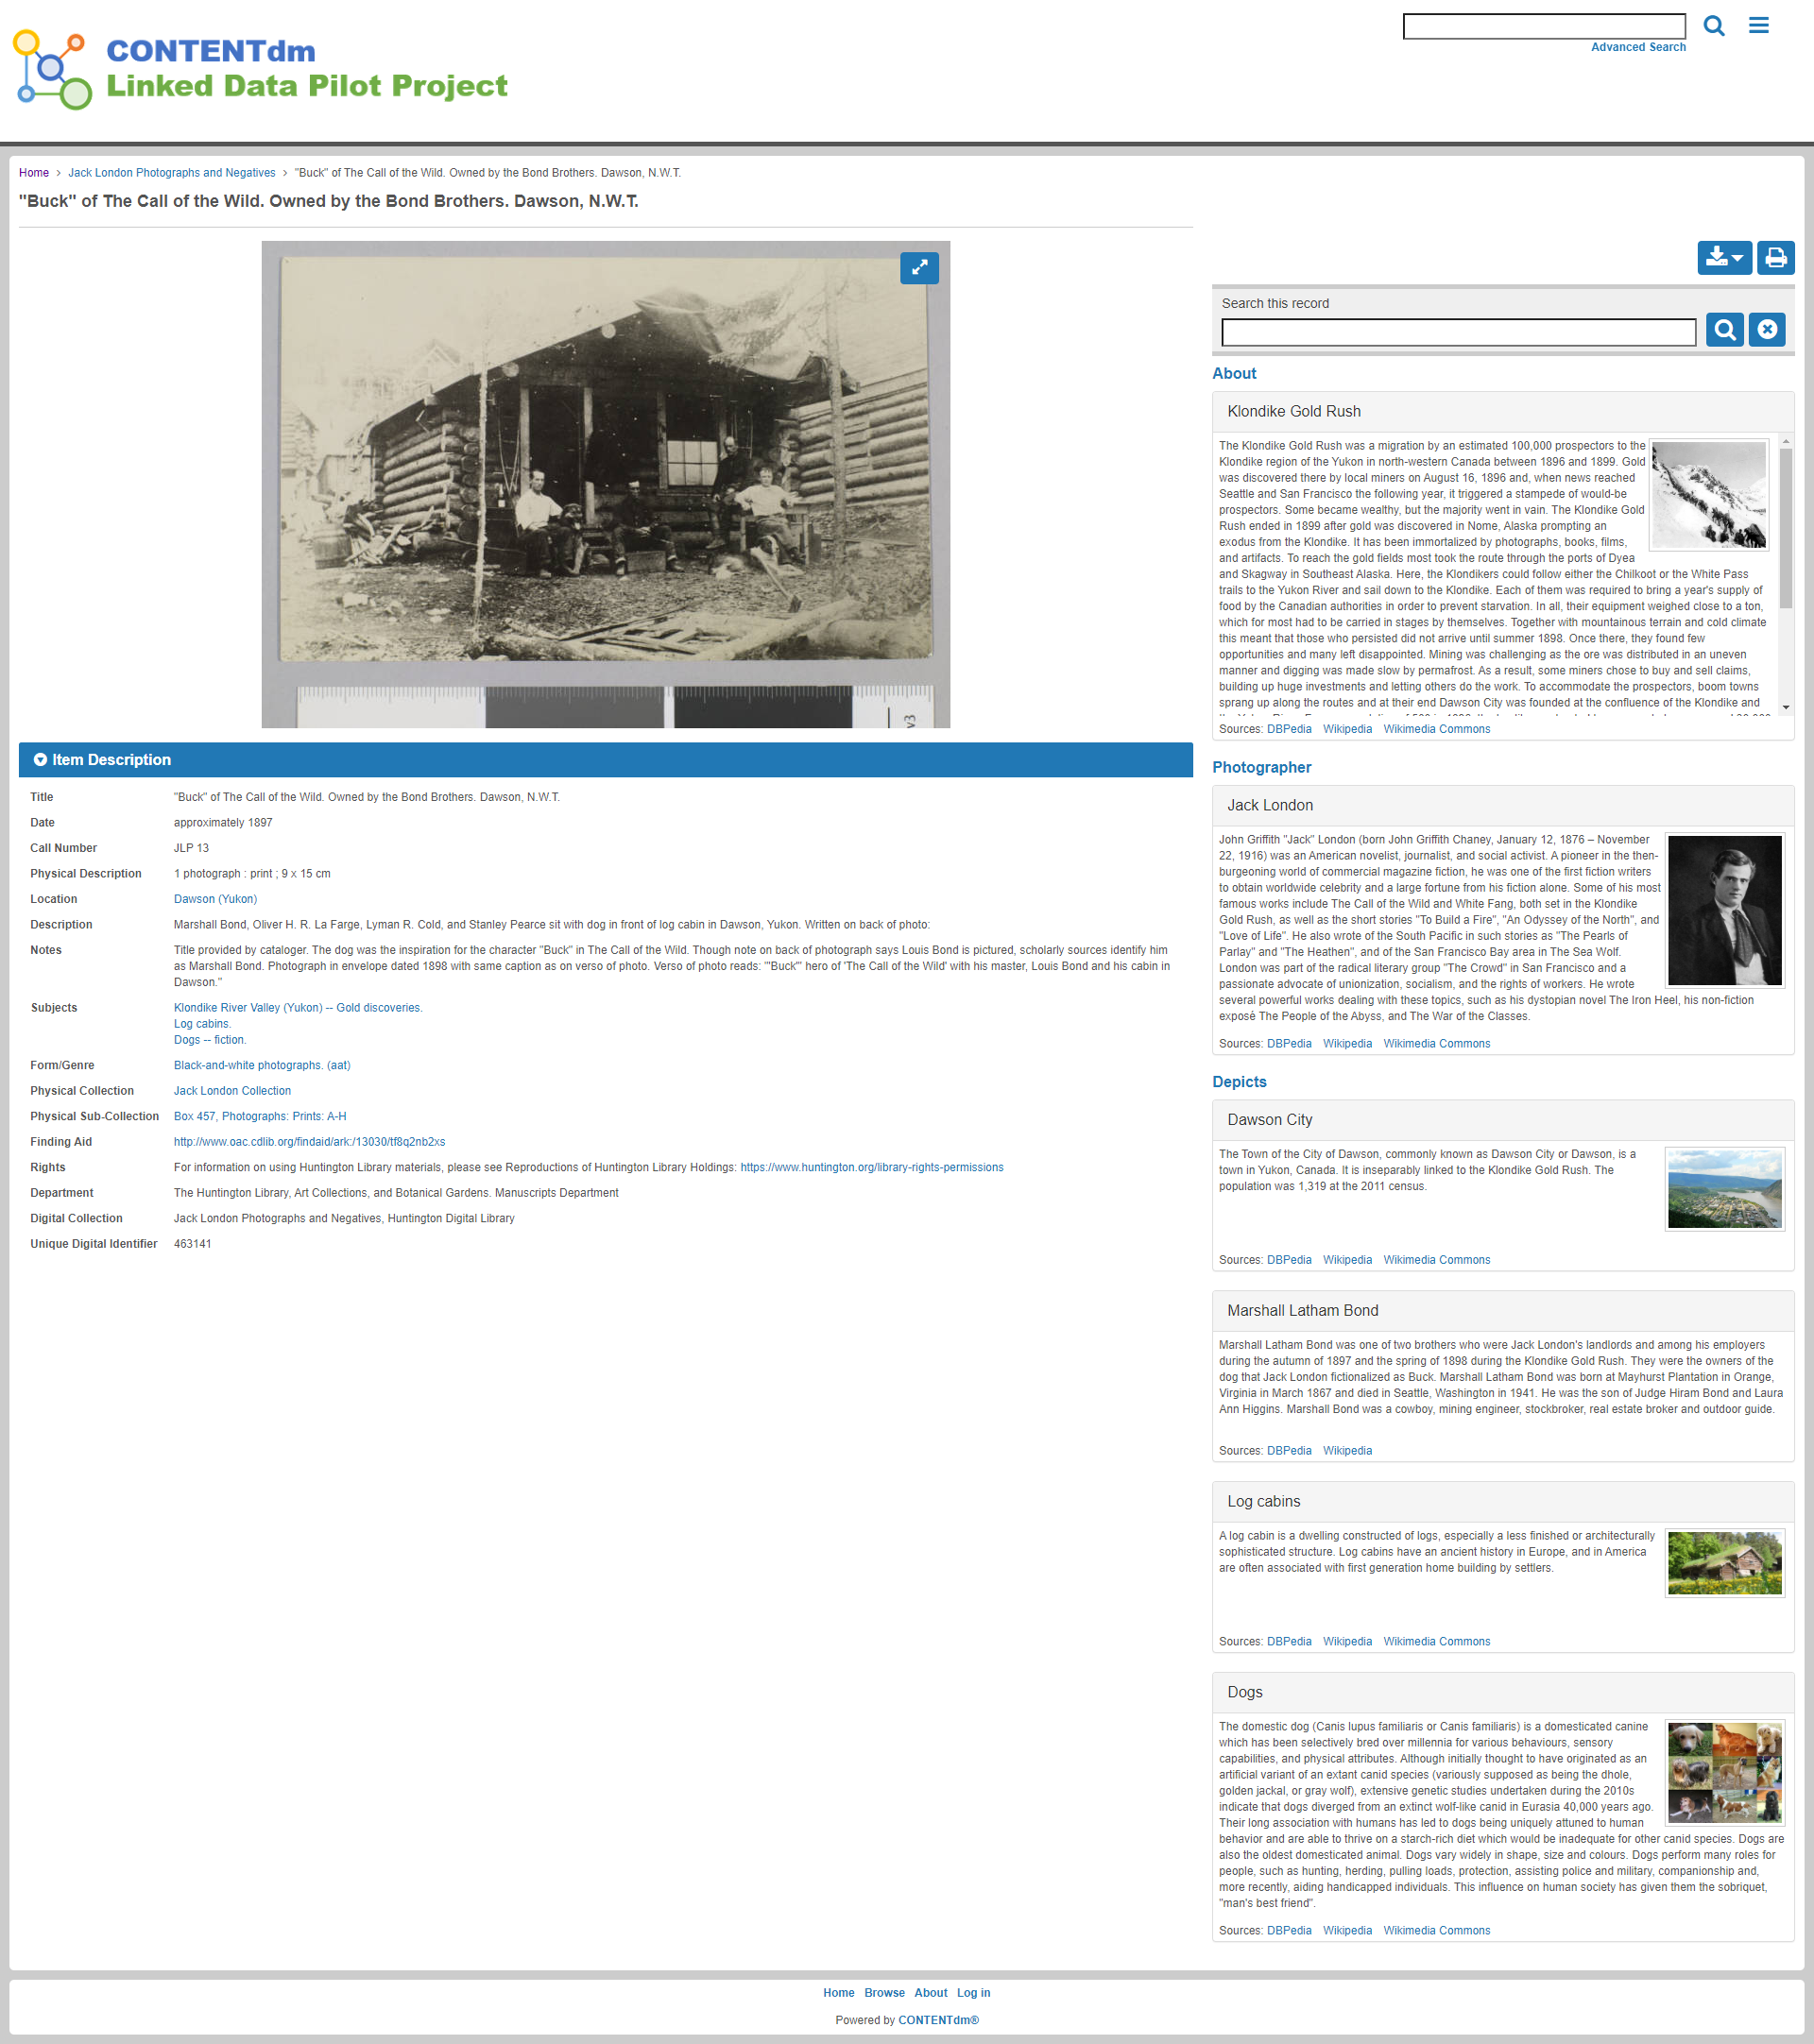
Example: CONTENTdm Linked Data Pilot Explorer (Image: CC BY)
4. Serendipitous discovery
The focus of keyword-search-and-filter interfaces is accuracy against a query. This has meant they tend not to be unsuccessful in enabling serendipitous discovery of related items. If they do, the related items tend to be selected based on the same underlying collection catalogue data as the search, meaning that suggested “related objects” tend to be “close to” the current object based on only a subset of possible relationships: namely, those in the catalogue.
Knowledge graphs cluster related items well, therefore they have the potential to facilitate serendipitous discovery – discovery of content to the user that is “[u]nintended but auspicious”. Serendipitous discovery didn’t begin with knowledge graphs, or even with digital content, rather it was a characteristic of libraries where you were able to browse. It is valuable to research, and therefore it is important to build-in digital versions to digital systems.
In Measuring the dimensions of serendipity in digital environments, McCay-Peet and Toms (2011)_ _seek to understand how serendipity can be enacted in digital spaces. They do so by introducing what serendipity is, how its been researched and how it has functioned in a number contexts, such as the physical spaces of libraries. It builds on the work of Björneborn’s 2008 Design Dimensions Enabling Divergent Behaviour across Physical, Digital, and Social Library Interfaces, specifically ten aspects:
- Unimpeded and direct access,
- Rich diversity,
- Curiosity-invoking display,
- Striking contrasts,
- Pointers,
- Imperfections,
- Cross contacts,
- Multi-reachability,
- Explorability,
- Stopability.
Through these physical dimensions of serendipity, McCay’s research proposed five factors that facilitate serendipity in digital spaces:
- Enabled connections
‘unimpeded and direct access’ to content, means connections between dissimilar resources can be made, creating previously unimagined new approach research questions/problems. - Introduced the unexpected
This is about the experience of serendipity - an aspect of it needs to be unanticipated. - Presented variety
Systems need to highlight the variety of content, they also need to facilitate exploration. - Triggered divergence
Make a system where ‘associations and bisociations’ in a user’s memory can be triggered by encounters with content, similar to the working practice of an Ethnographer. - Induced curiosity
The system needs to ensure that the user does not become a ‘passive observer’, rather curiosity needs to be inspired by how content is displayed.
Example: Generous Interface Fashion (About)
5. New entry points
Thematic entry points allow for collection objects to be seen as part of a ‘greater system’. Windhager et al. In Visualization of Cultural Heritage Collection Data: State of the Art and Future Challenges they suggest that collection entry through historical events allows collections to be situated and understood in their historical context. This could lead to onward journeys through historical events, significant world events, movements, or subject areas. Indeed, this is how we hope it will be possible to navigate the collections via the Heritage Connector interface, through ‘topics’ - for example: significant world events, movements or subject areas.
Organizing entry points in the collection through a theme is a well-established museological practice, as is seen with temporary exhibitions and permanent galleries. Entry points into the collection may be manually created “showcases” – as in this example from the V&A. Alternatively, they may use an existing datapoint in the collection – as in this example from the Science Museum Group. Usually, entry points are manually selected to provide a reliable and high-quality experience. Knowledge graphs allow this to be automated and scalable to an entire collection, indeed to multiple collections.
Using data-points in the knowledge graph, new entry points into the collection that use associated links and clustering can be created to create thematic, topic, event, geographic and other entry points which would not be possible using the object-level data in the collection catalogue. Knowledge graphs enable the clustering of content, much like when things are physically grouped by subject area in a library, facilitating serendipitous discovery.
Furthermore, when tied to a macro-level view of the collection, clustering of similar objects, people, genres, etc, can both give a general overview to the user immediately but could also allow a dynamic clustering of object records – as demonstrated with literature in An Ocean of Books and Open Syllabus. In short, this approach allows for greater understanding of the breadth and depth of the collection in relation to a user’s entry point.
Clustering of objects visually allows overviews of subjects, to see connections between objects and other nodes, and how they relate to one another. In this way, the space between nodes can infer closeness of relationships between people, objects and other data points.
When exploring a moment in history or in a movement, an interface that allows for thematic entry points is more valuable than an object-centred search function. Furthermore, connecting collections to Wikidata allows for things to be associated with events and movements where those are not (usually) held within collections management systems. Designing an interface using the Heritage Connector knowledge graph allows for the collection to be navigated through thematic entry points, defined by and responsive to user’s interests, research needs or even whim.
Example: Wien Museum: Online Sammlung: Suggestions
Example: Every noise at once
6. Rich onward journeys
At the object level, there is an opportunity to use the knowledge graph to provide a range of rich onward journeys, navigable by the user. Using a knowledge graph to generate connections means they are scalable to entire collections and beyond. The information available could relate to specific collections, and thus proactively surface insights with related content on object, people, organisation and other pages. Linking, in new ways, to other collection material but also to other collections, Wikipedia and third-parties via Wikidata.
Use of Wikidata as a way of linking to related material and surfacing related content is most widely known through the Google Knowledge Panel. The Knowledge Panel is the right-hand panel on Google Search results pages that provides headline information for a given search which frequently draws on Wikidata and Wikipedia for its content. However, there are problems with attribution identified with the Knowledge Panel’s information, and such easy access to headline information may even hinder onward journeys. Knowledge panels surfacing collections information from third-party resources may nonetheless provide valuable context.
Example: Google Search Knowledge Panel
Example: Royal Academy of Art: Art and Artists
Example: CONTENTdm Linked Data Pilot Explorer (Image: CC BY)
7. New forms of interface
New forms of rich interfaces for online collections have been hindered by incompatible collections data. In recent years, there has nonetheless been a growing interest in new forms of “generous interface” which were imagined in 2015 as a way to mediating heritage online to reveal ‘the complexity and diversity of cultural collections.’ Previously introduced in a Science Museum Group Digital Lab blog post on exploring museum collections, generous interfaces would enable navigation through cultural heritage collections and moving away from free text search. Five key principles introduced include:
- Show first, don’t ask (provide rich overviews without search)
- Provide samples and clues (using collection content)
- Show relationships (between collection features)
- Provide rich primary content (deliver on the promise)
Interfaces are usually bespoke, because of data limitations, but automating connections with a knowledge graph could mean scaling almost entire collections. There is a challenge in understanding user needs, in order to match them with all or part of the collection. An evaluation of the principle of generous interfaces by Europeana revealed through user testing that ‘inspiration-seeking digital flaneurs’ (i.e. non experts) found them inspirational and conducive to serendipitous discoveries.
Example: Visualising the Royal Photographic Society collection: Historical photography at the V&A Museum
Example: Tyne & Wear Archives & Museums Collections Dive (about)
Example: Witches, University of Edinburgh
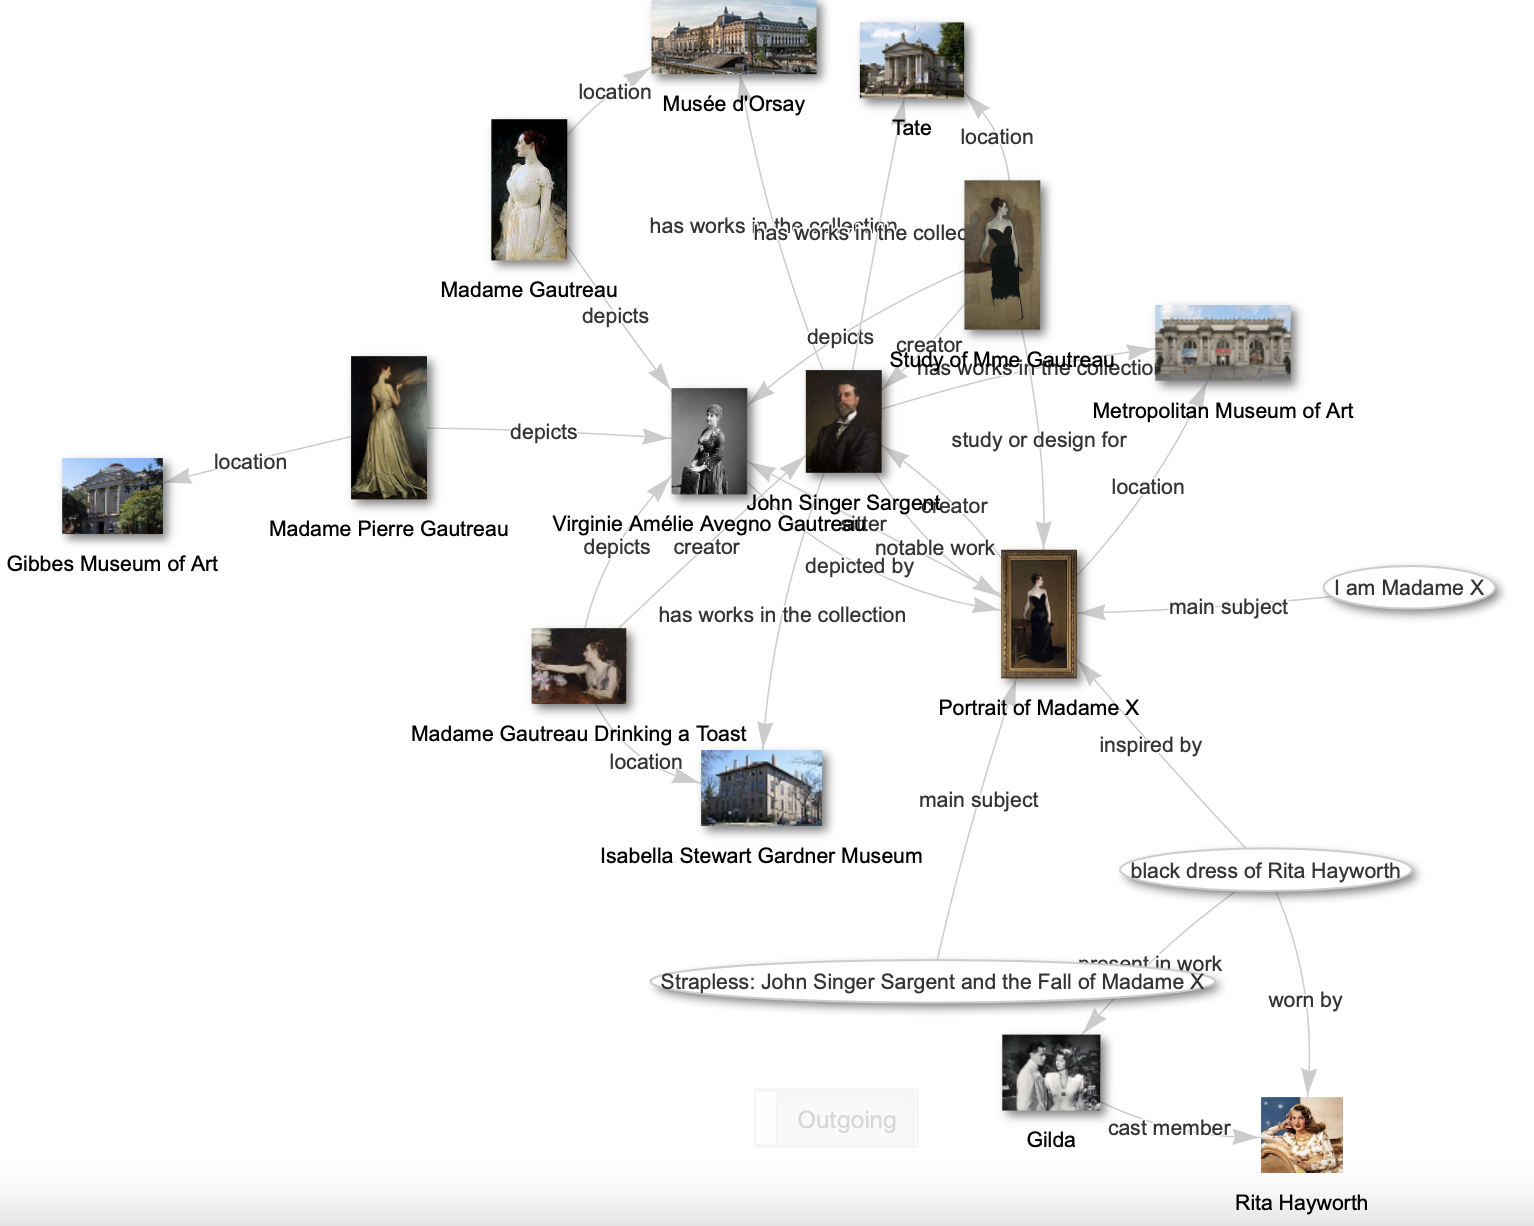
Example: Wikidata query spider diagram (about) (Image CC 0)
Emerging questions, issues and considerations
Among the questions related to user interfaces emerging from this work are:
- How is it best to balance (or not) the needs of experts (who tend toward search) with those of casual users (who tend toward browsing and image-led discovery), and also to ensure interfaces are as simple as possible?
- How is the fuzziness and uncertainty of the machine-generated links best represented in user interfaces?
- How can the provenance of the data be presented in user interfaces?
- Where false positives are uninteresting and/or not useful, should these be able to be flagged by users for removal?
- Is presenting useful connections and associations the same in different areas, themes and subject domains and if not, how is it best to handle this?
- If knowledge graphs can create links that make onward journeys through collections possible, what visualisation will best enable this?
- To whom and in what context is serendipitousness most useful as “thorough user studies have not yet been conducted that would help us to fully understand how specific design decisions influence users’ perception of serendipity” and it is conceptually complex to model and measure?
- Where is the greatest value of knowledge-graph-driven interfaces: high-level tasks (macro views), mid-level tasks (filtering) or low-level tasks (object level)?